OEPP — Metrics Dashboard Help
This help section provides detailed information about the OQuaRE metrics
used to evaluate the quality of ontologies. Each metric is calculated
based on specific ontology elements and contributes to a comprehensive
understanding of the ontology's characteristics.
Ontology Quality Metrics
-
Lack of Cohesion in Methods (LCOMOnto): Measures the
semantic and conceptual relatedness of classes in an ontology. A lower
score indicates better cohesion.
-
Weighted Method Count (WMCOnto): Calculates the mean
number of properties and relationships per class. Higher values may
indicate greater complexity.
-
Depth of Subsumption Hierarchy (DITOnto): Measures the
length of the longest path from the root class to a leaf class. Deeper
hierarchies may be more complex.
-
Number of Ancestor Classes (NACOnto): Calculates the
mean number of ancestor classes per leaf class. Reflects the inheritance
hierarchy.
-
Number of Children (NOCOnto): Measures the mean number
of direct subclasses per class. Indicates the breadth of the ontology
hierarchy.
-
Coupling Between Objects (CBOOnto): Quantifies the
number of related classes. Lower coupling is often desirable for
maintainability.
-
Response for a Class (RFCOnto): Measures the number of
properties directly accessible from each class. Reflects class
complexity.
-
Number of Properties (NOMOnto): Calculates the average
number of properties per class. Provides insights into property
richness.
-
Properties Richness (PROnto): Evaluates the number of
properties defined relative to the total number of relationships and
properties.
-
Relationship Richness (RROnto): The number of usages of
object and data properties divided by the number of subclass
relationships and properties.
-
Attribute Richness (AROnto): Measures the mean number
of attributes per class. Reflects attribute complexity and richness.
-
Relationships per Class (INROnto): Calculates the mean
number of relationships per class. Indicates relationship complexity.
-
Class Richness (CROnto): Evaluates the mean number of
instances per class. Reflects instance diversity and abundance.
-
Ancestors per Class (POnto): Evaluates the number of
ancestors per class by dividing the number of superclasses per each
class.
-
Annotation Richness (ANOnto): Measures the mean number
of annotations per class. Reflects the extent of metadata associated
with classes.
-
Tangledness (TMOnto): Evaluates the mean number of
parents per class, considering multiple inheritance. Reflects class
hierarchy complexity.
Interpreting Scores
The formulas for calculating each metric are shown in the image below:


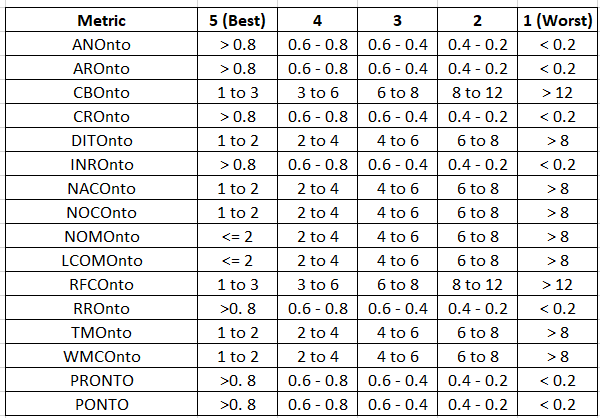
Scores for each metric can be interpreted as follows:

Calculating Subcharacteristics
Each metric contributes to one or more quality subcharacteristics, which
are used to evaluate the overall quality of an ontology. The
subcharacteristics include:
-
Modularity: Measures the extent to which an ontology
can be divided into smaller, independent modules.
-
Reusability: Reflects the extent to which ontology
components can be reused in other contexts.
-
Analyzability: Indicates the ease with which an
ontology can be analyzed and understood.
-
Testability: Reflects the ease with which an ontology
can be tested and validated.
-
Modular Stability: Measures the extent to which an
ontology's modules remain stable over time.
Interpreting Scores for Subcharacteristics
Scores for each subcharacteristic can be interpreted as follows:

Overall Quality Score
The overall quality score can be interpreted using the image below:

Color Scheme For Scores:
The color scheme used to represent scores from 5(Best) to 1(Worst) is as follows:


